Customize Your Dashboard
Dashboard Editor
Within the Control Panel>Administration click EDIT DASHBOARD to begin customizing your dashboard display.
The EDIT DASHBOARD page will only be available to those users whom have been granted permission to edit the dashboard from the Roles and Permissions.
Sample widgets will be available which you can edit or remove.
From the Dashboard Editor you can perform the following actions.
- Toggle between viewing Public and Private widgets.
- Public widgets are able to be viewed by more than one user
- Private widgets are only able to be viewed by the user that created it and set the viewing permissions to ONLY ME
- Preview the Dashboard as yourself or as another user
- Reorder widgets by dragging them from the left corner
- Edit a widget
- Preview a widget
- Clone a widget to make a copy of it
- Delete a widget
- Add a new widget
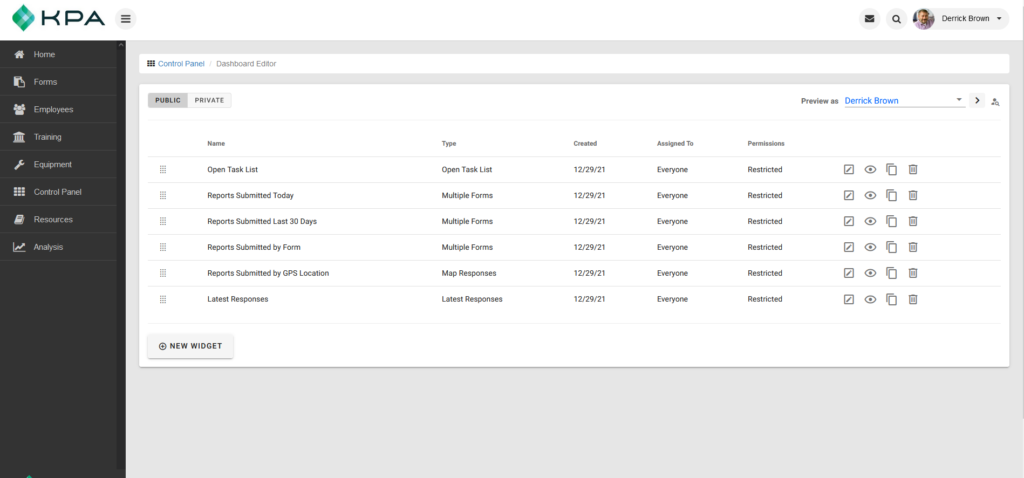
Add a new widget
To add a new widget to the dashboard click NEW WIDGET at the bottom of the widget list.
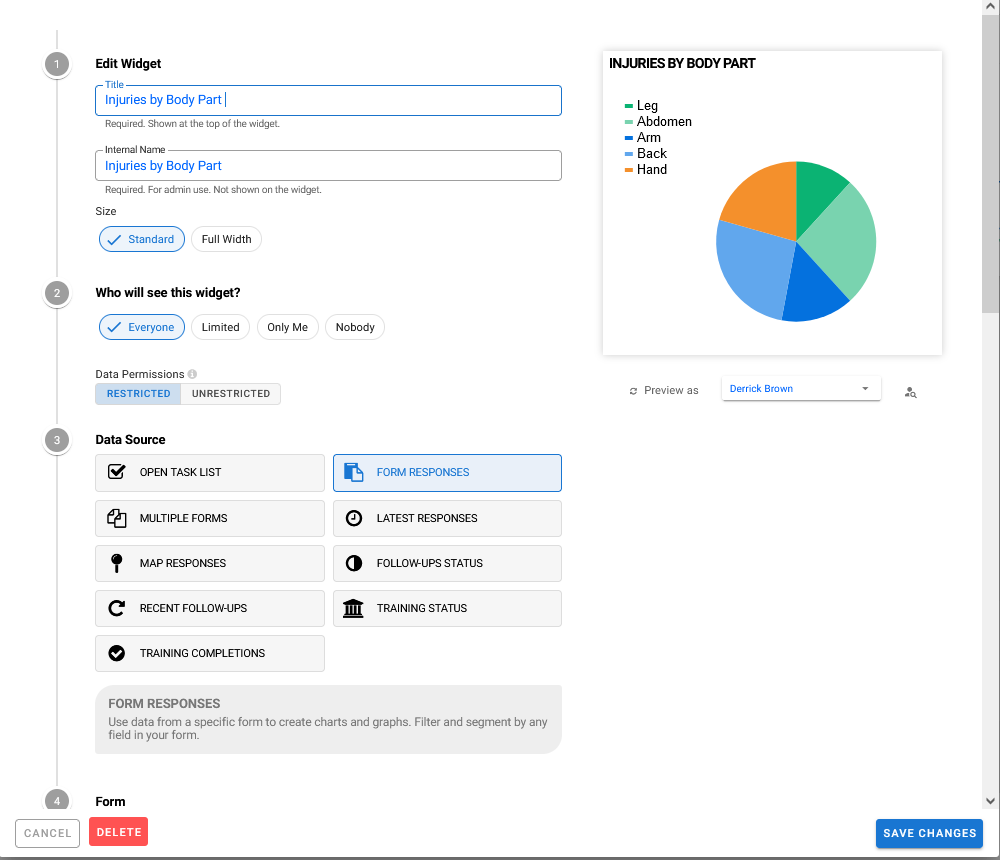
Adding a new widget will require you to choose a Widget Title that will appear on the top of the widget as well as an Internal Name.
Widgets can be standard or full width which represents the amount of space a widget takes on the dashboard display.
Widget Permissions
For each widget you will need to determine which users are able to view the widget on their Dashboard.
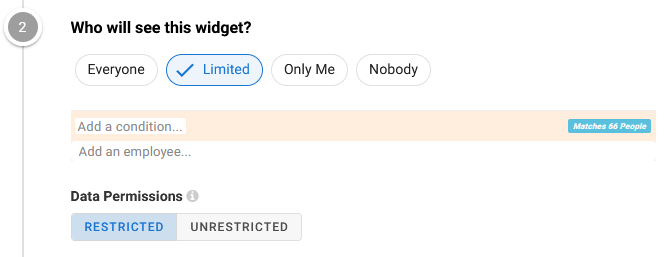
Setting a LIMITED permission for a widget will allow you to specify the types of users that should see the widget which could be limited based on role, location, position, etc.
Data Permissions can also be RESTRICTED or UNRESTRICTED. Unrestricted permissions means that the widget may display data that was previously restricted through the employee’s role.
Choose “Restricted” if you wish to limit data according to the employee’s role.
Widget Data Sources
To begin building a widget you will need to select the source of data you wish to include in your widget display.
Multiple options of different data sources are available to choose from.
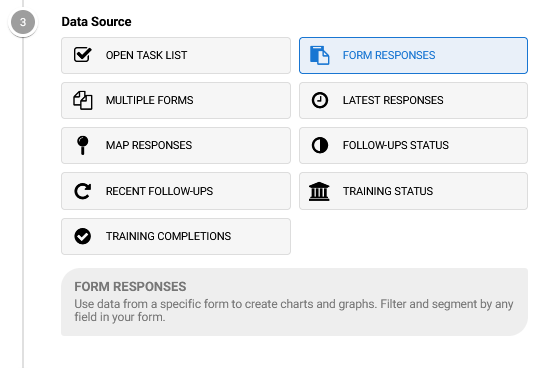
- OPEN TASK LIST – Shows each user their own listing of open tasks.
- MULTIPLE FORMS – Look at charts and graphs of data across all your different forms. Filter and segment by date, observer, and more.
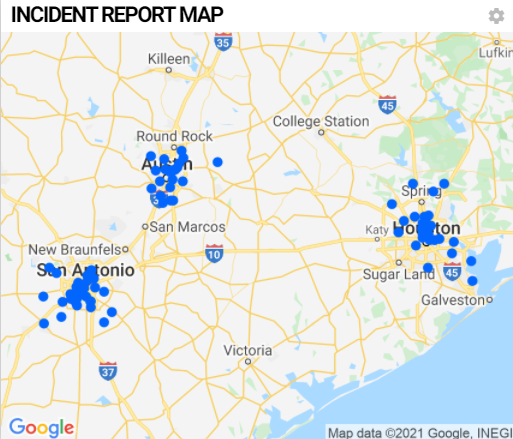
- MAP RESPONSES – Map the GPS positions of the latest form responses filtered by date, observer, form, and more
- RECENT FOLLOW UPS – List out the latest follow-ups filtered by status, date, form, and assignee.
- TRAINING COMPLETIONS – Build charts and graphs from training completions organized by topic, location, status, and more.
- FORM RESPONSES – Use data from a specific form to create charts and graphs. Filter and segment by any field in your form.
- LATEST RESPONSES – See the latest form responses filtered by form, observer, and date.
- FOLLOW-UPS STATUS – Create charts and graphs of follow-ups by status, creation date, location, and more.
- TRAINING STATUS – Build charts and graphs from training status organized by topic, location, status, and more.
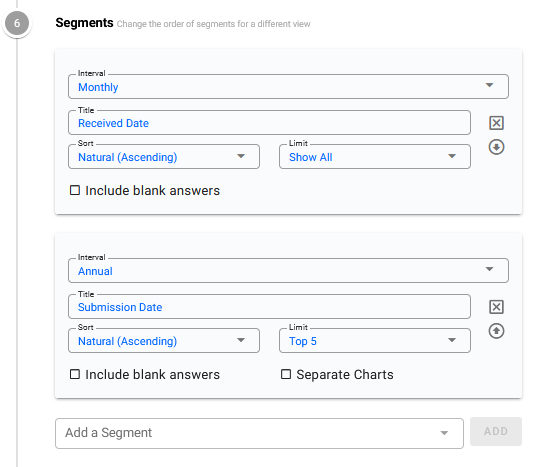
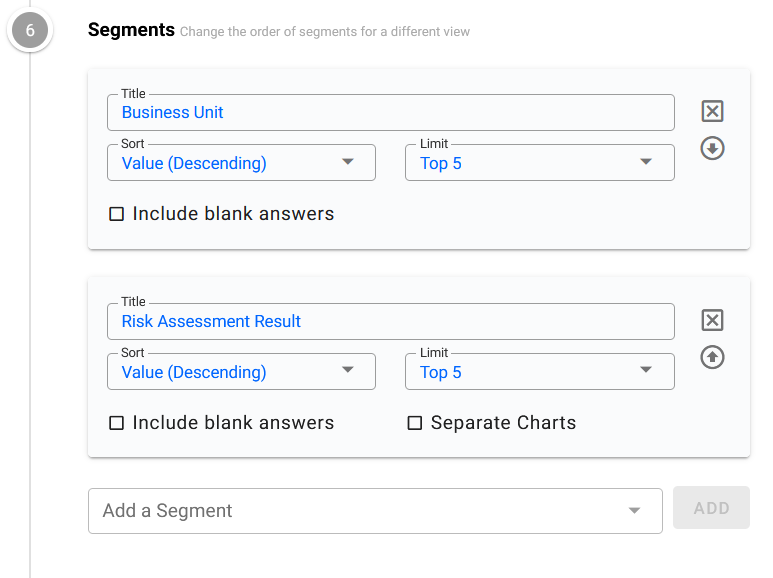
Segments
Segments within a widget allow you to separate data by different data elements in order to do comparisons.
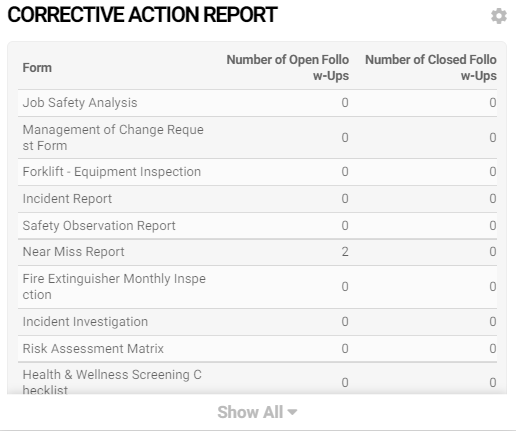
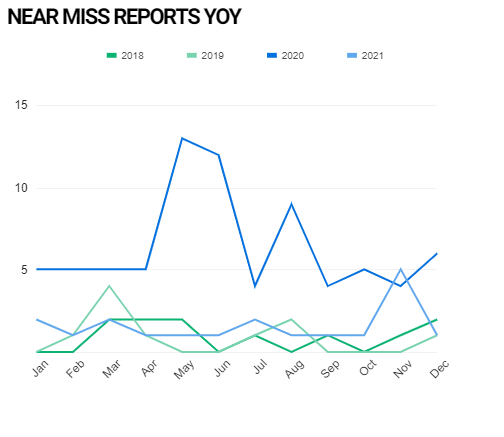
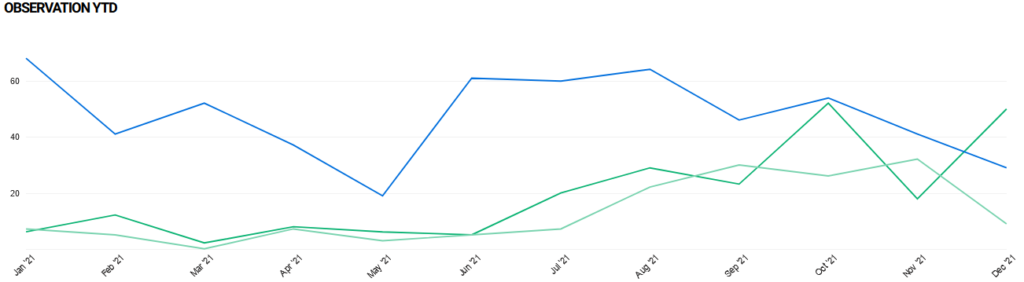
An example of data segmentation is included below where we wanted to segment our near miss reports by month and also by year so we can view Year over Year comparisons.
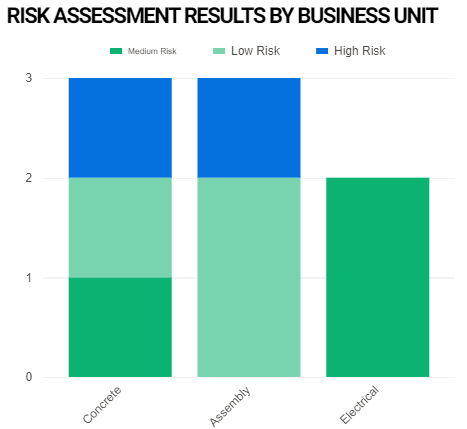
Segmenting by business unit or location is another example where we are able to compare the Risk Assessments for each business unit.
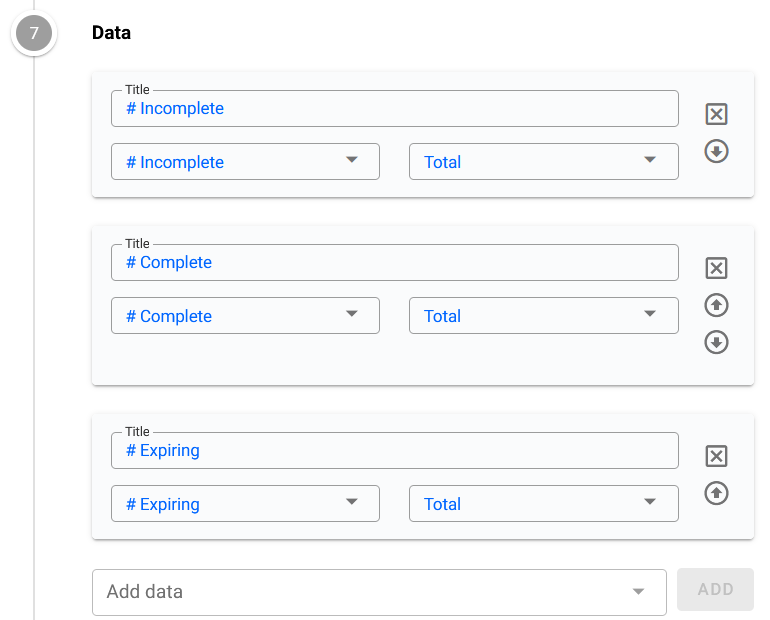
Data
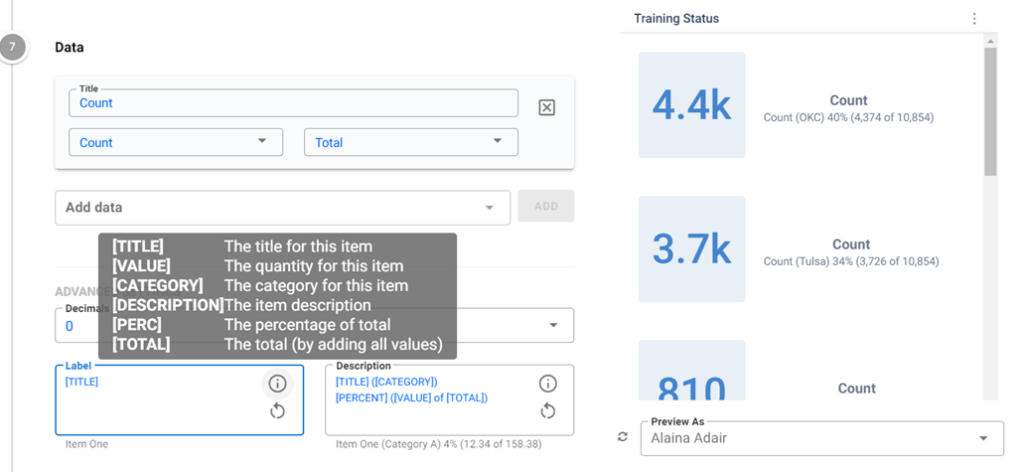
Selecting the data we would like to display within a widget allows you to identify the unit type and format you prefer the count of data to appear in.
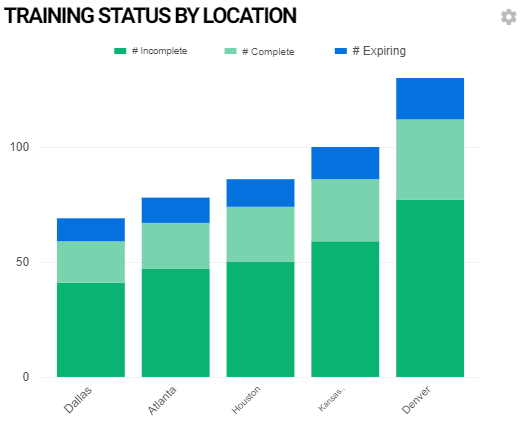
When building a widget for training related data you have additional options to separate your training data counts by training status.

Advanced Settings:
Changing the decimals will show that number of decimals on the widget.
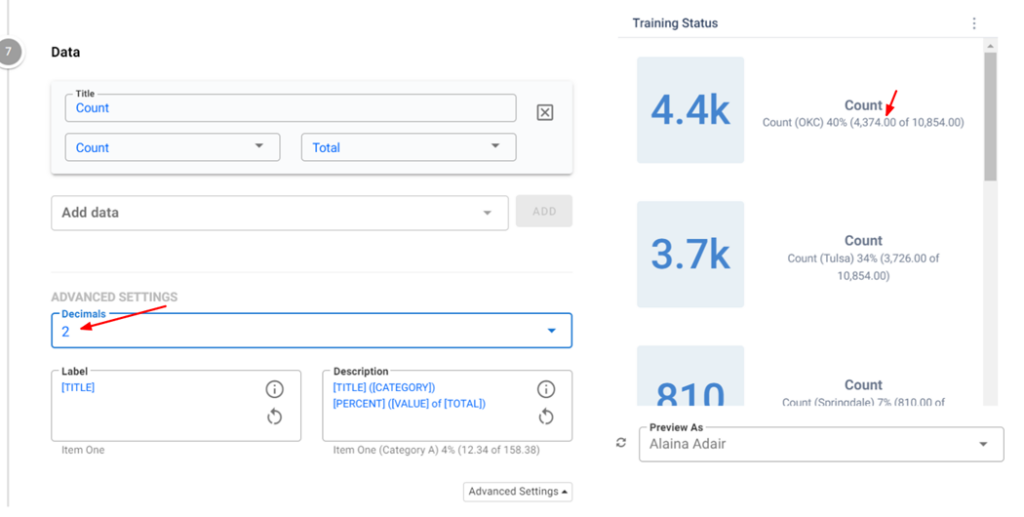
The info bubble will show the available options to type into the Label or Description to change items shown on the widget.
- [TITLE] The title for this item
- [VALUE] The quantity for this item
- [CATEGORY] The category for this item
- [DESCRIPTION] The item description
- [PERC] The percentage of total
- [TOTAL] The total (by adding all values)
The Label shows in bold text. In the example shown below, the Category is shown as “OKC” and the Title is shown as “# Complete”. The Description shows in regular text. In the example shown below, the Percent is shown as “45%” and the Value of Total is shown as “85 of 191”.
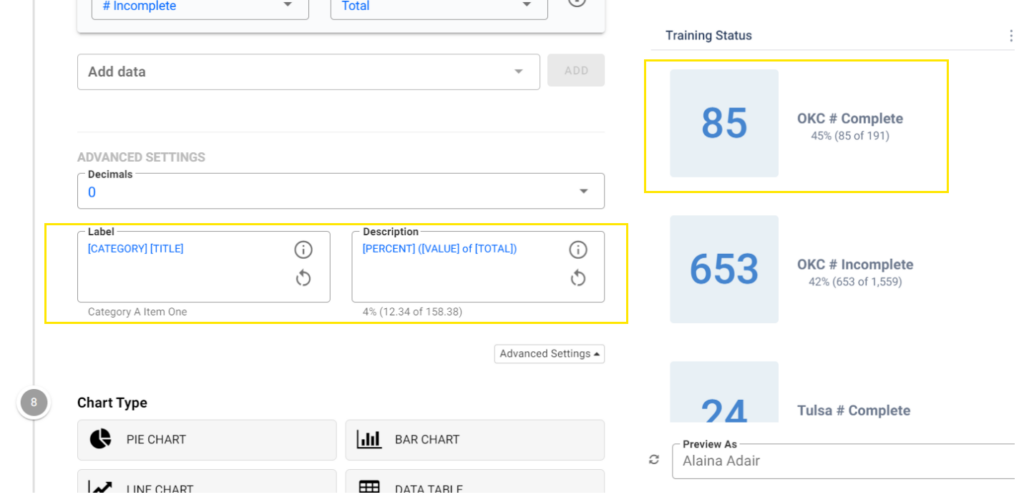
Chart Types
A chart type can be selected which allows you to identify the display format of the widget data.
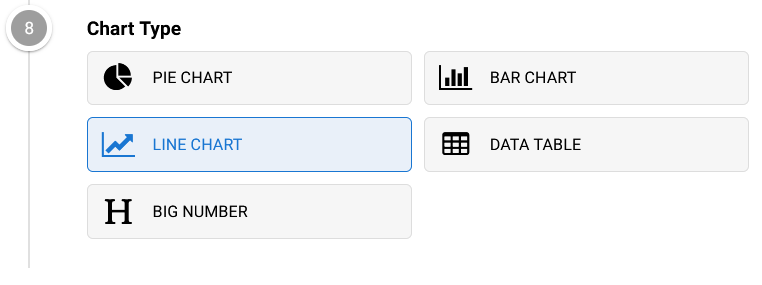
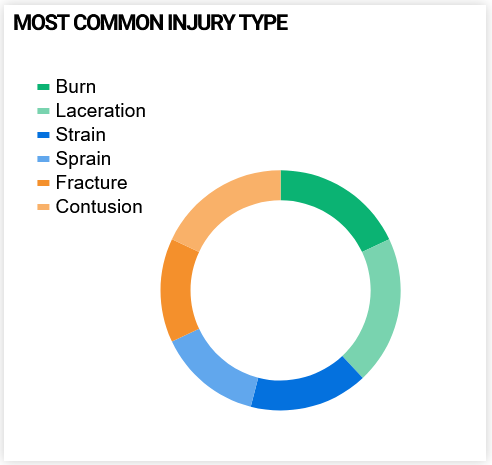
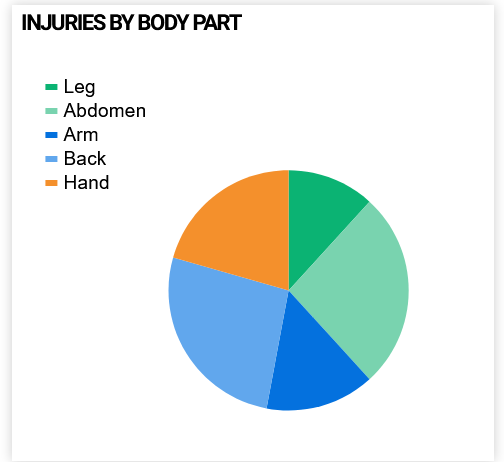
Pie Chart – Pie charts can be displayed in either a filled pie or donut style.
Line Chart – Line charts display trends over time.
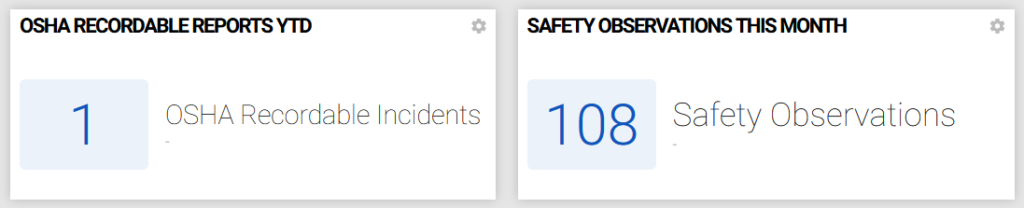
Big Number – Big number charts display a total count of a selected data set.
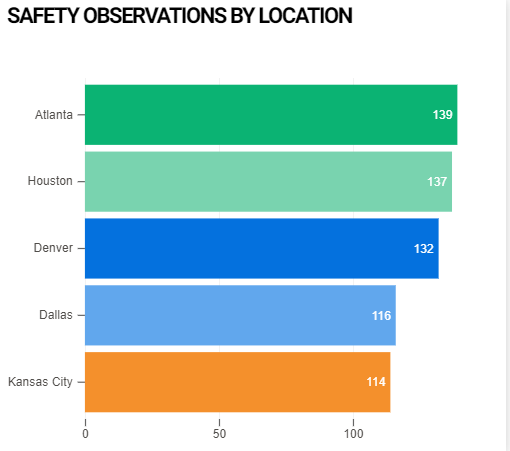
Bar Chart – Bar charts can be stacked or side by side to show data comparisons.
Data Table – A data table displays a grid view of information.